
We live in a time when technology is evolving at a rapid pace, with various tools that help translate and analyse large volumes of data for various purposes. However, it’s a lost cause if the user is unable to understand or interpret the data provided. This is where good user interface design comes into play. The visual representation of the data on a dashboard and the way these elements are as important as its functionality. Poorly designed dashboards could fail to provide correct insights or useful information, and end up causing major analytics projects to hit roadblocks or even fall through altogether.
So how do you make sure your dashboard stands out and helps users navigate them more efficiently?
i) Prioritize the content
First, it’s important need to gain an understanding of what the user is trying to get out of the dashboard. Is their primary goal to check levels of traffic and conversion rates? Maybe they want to see a comparison of monthly sales. Having a clear idea of what the Key Performance Indicators (KPIs) are is the first step to coming up with a design layout for the dashboard interface. Based on this, content that needs to be available on the dashboard can be prioritized.
Prioritization of content, like any other part of developing a dashboard, can be divided into two parts: the UX side and the UI side. While the UX side is what will provide the functional hierarchy for the content, the UI side is equally important for highlighting the key concepts or values that the user requires. That is, the information needs to be presented in an eye-catching and appealing manner, leaving no room for error in interpretation.
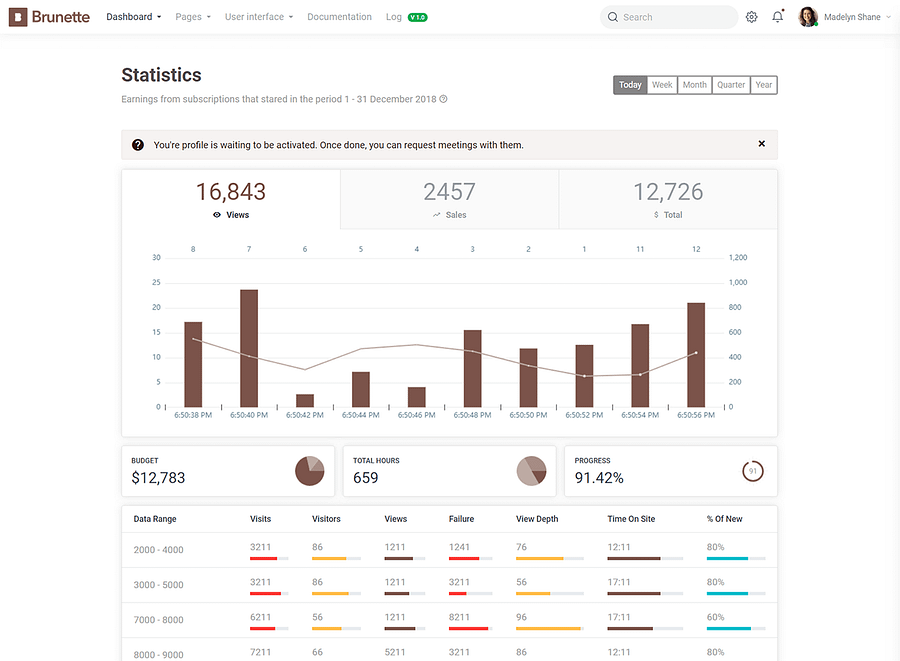
Keep the most vital metrics at the top so that it’s available to the user at a glance, followed by supporting information below it. This would reduce the time that the user spends searching for relevant data as well. Maybe it’s their yearly revenue showcased in the form of a graph at the top of the page. Maybe it’s the website traffic and conversion rate in percentages. Always keep in mind the end user of the dashboard and choose the right visualization tools, widgets and additional plugins based on what they would like to see.
ii) Keep it minimal and clean
When it comes to effective dashboard design, less is always more. Whether it’s in terms of graphs shown on the page or the number of widgets activated, make sure there’s enough space to distinguish the elements without overwhelming the user. Use simple data visualization tools that are simple enough to comprehend and work well in compact spaces, especially for smaller screens. Try to avoid 3D charts and complicated designs, and instead, stick to flat ones which are cleaner and easy on the eyes.
A trick to keep your dashboard UI looking professional and easy to understand is through the usage of suitable icons to denote sections. Not only do they help break the monotony of text, a lot of symbols can be considered as a universally understood language. For instance, a plus symbol typically means to add/insert, a trash icon is to delete, social media feeds have their distinguishable brand icons, and so on.
Remember, simplicity lends itself to efficiency, and fancy designs aren’t always the best ones.
Try out the Pangong Bootstrap 4 Admin Dashboard Template, a minimal and clean layout with a variety of pre-built UI components to help you build a professional dashboard.

iii) Maintain consistency of fonts and color usage
It goes without saying that fonts and colors are an important part of any dashboard design. Make sure you don’t use more than two different fonts in a dashboard design, in order to maintain a professional look to it. By using distinctive colors and varying sizes, dashboards can be designed to guide the user through the visual representation on screen, thereby allowing them to make connections in a seamless manner. Prioritize your content by using fonts, colors, and varied sizes to depict the hierarchy of information.
Apart from distinguishing sections of information with color changes, it’s also important to be mindful of what tones are being used in symbols, charts, and other visual tools. For instance, using red to denote an increase in sales would be counterproductive to the cues that people have been conditioned to understand. As we all know, red is usually used to denote decline or danger, so using it in a positive scenario would only lead to confusion. So make sure you use the right colors to denote different things. Design and color theory suggest to keep a maximum of three colors in your palette — one for headings, one for body, and one for accents and links.
Additionally, it is also necessary to make the right color and font choices based on the industry or objective of the dashboard interface. Wouldn’t be odd to see a corporate dashboard in vibrant pinks and greens? Make sure you keep your target user in mind when choosing design elements for your dashboard.
Check out the Philbert Bootstrap 4 Admin Dashboard Template for a complete set of easy-to-use demos that are targeted towards various industries and purposes. It comes with 2000+ font icons, multiple colour schemes, and lots of charts, widgets, and data visualisation components that would help you build a UI dashboard in a simpler, streamlined manner.

iv) Don’t be afraid to use ready resources
Whether you’re freelancing for a client or a full-time developer in a company, there are various resources available to make your job easier and more efficient. You don’t need to spend a lot of time figuring out the UI components, responsiveness, and additional plugins for the dashboard you’re building when you have ready-to-use, fully customizable packages available for online. Check out some of the pre-built dashboards listed below to see which would suit your purpose, and spend more time fiddling around with the functionalities already present!


By choosing the right tools, Colors, widgets, you can create dashboards that are easy for anyone to use, thereby increasing capabilities and guiding future growth.
Happy Dashboarding 🙂